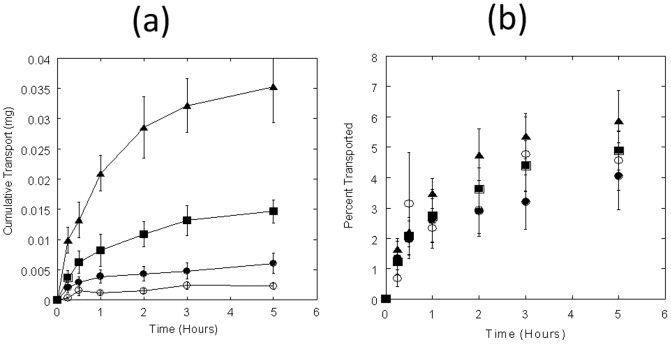
Figure 1. FITC-insulin transport across Caco-2 monolayers.
(a) Time-course study of FITC-insulin transport (mg) at different loading concentrations. FITC-insulin was loaded in apical chambers at 0.05 (open circles), 0.15 (filled circles), 0.3 (squares), and 0.6 (triangles) mg/well respectively; and permeation was measured by measuring the fluorescence in samples collected from basolateral chamber at different time-points up to 5 hrs. (b) % FITC-insulin transport across Caco-2 monolayers. Data represent mean±SD (n = 3).

