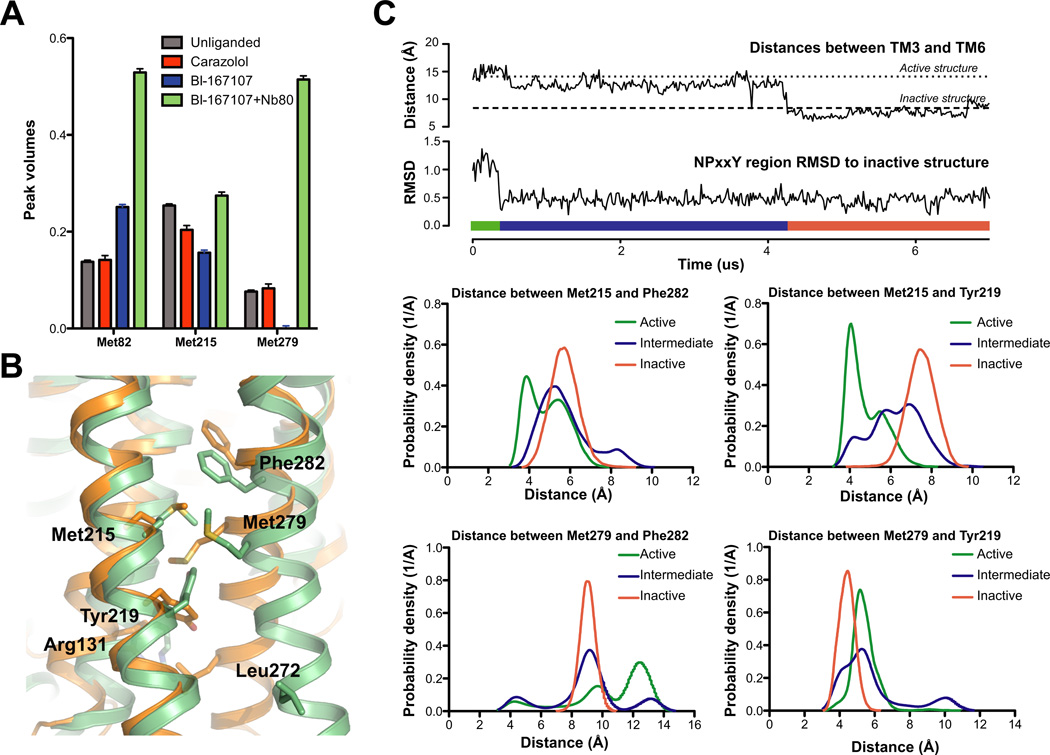
Figure 6. Agonist binding promotes conformational heterogeneity around Met2155.54 and Met2796.41.
A) Peak volumes for individual methionines. Automated 2D line-shape fitting was performed on the spectra using NMRpipe (Delaglio et al., 1995). From the line-shape analysis volumes of the different peaks were extracted. The peak volumes were normalized to the peak volume of Met36. After extracting peak volumes we estimated their uncertainties by evaluating the RMS from the volumes of 10 peaks chosen from regions of the spectrum where no signal could be detected in the 2D spectrum. For Met82 the peak volumes in the carazolol and the unliganded state are averages of peak intensities of the two most intense Met82 peaks. Although NB80 would be expected to reduce tumbling of the receptor in solution and thereby weaken signals, we see signals intensify suggesting a stabilization of the receptor and a more uniform distribution of conformations compared to the agonist bound form (see also Fig. S5).
B) Region around Met2155.54 and Met2796.41 shown for the active (green, 3P0G) and inactive (orange, 2RH1) structures of β2AR. Met2155.54 and Met2796.41 and aromatic residues in the vicinity of Met2155.54 and Met2796.41 are shown as sticks. Arg1313.50 and Leu2726.34 are also shown as sticks.
C) Simulations of β2AR starting in the active conformation with Nb80 removed spontaneously transition back to the inactive conformation. Top two plots illustrate a transition from the active conformation to the inactive conformation during an MD simulation (adapted from Fig. 2 of Dror et al. (2011a)). The transition starts with the re-arrangement of TM7 into its inactive conformation, as illustrated by the plot of TM7’s RMSD to the inactive crystal structure; subsequently TM6 moves inward towards TM3, as illustrated by the plot of distances between TM3 (Cα of Arg1313.50) and TM6 (Cα of Leu2726.34). We call the state between the re-arrangement of TM7 and the inward movement of TM6 the intermediate state. The bar in the bottom of the plot illustrates what part of the simulation is considered the active (green), intermediate (blue) and inactive (orange) state.
The bottom four plots illustrate the distance distributions during the simulation between two NMR probes (Met2155.54 or Met2796.41) and two nearby aromatic residues (Tyr2195.58 or Phe2826.44). The distance distribution of the active conformation is based on simulations of β2AR with BI-167107 and Nb80 bound; the inactive state is based on simulations of the carazolol bound receptor, and the intermediate state is based on simulations with only BI-167107 bound, as illustrated in the two top plots. See Table S3 for additional details about molecular dynamics experiments.

