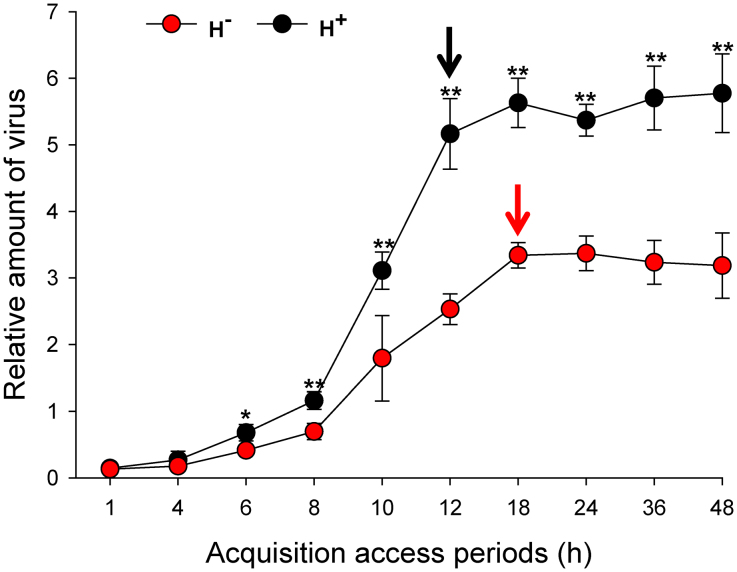
Figure 3. Relative amount of TYLCV (normalized to the host nuclear β-actin gene) in H+ (black dots) and H− (red dots) Q whiteflies (B. tabaci) after 10 acquisition access periods (AAPs) as determined by q-PCR.
Values are means ± standard deviation. Asterisks indicate that gene expression was significantly greater in H+ than in H− Q (* P < 0.05, ** P < 0.01). The black and red arrows indicate the time when viral titer reached a steady-state in H+ and H− Q, respectively.

