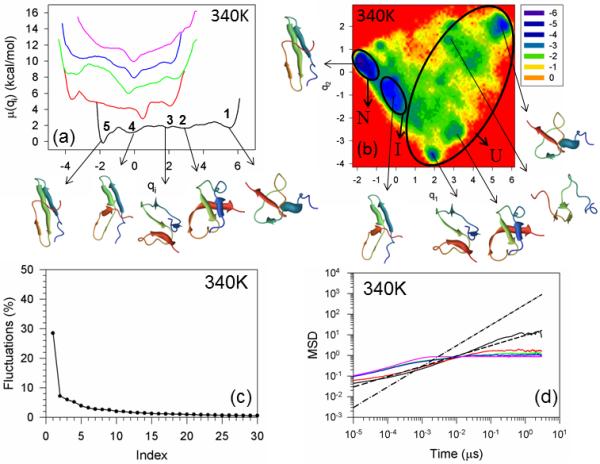
Figure 2.

Free energy profiles of the first five principal components for folding MD trajectories for FBP28 WW domain at 340K (panel a). The black, red, green, blue and pink solid lines in panel (a) correspond to FEPs along the first (with representative structures at the minima), second, third, fourth, and fifth PCs, respectively. The free-energy landscape (in kcal/mol) along the first two PCs with representative structures at the minima for folding MD trajectories at 340K for FBP28 WW domain is shown in panel b. The letters “U”, “I”, and “N” correspond to unfolded, intermediate (with 4.0Å < RMSD < 6.0Å of representative structures), and native states, respectively. The percentages of the total fluctuations captured by the first 30 PCs for FBP28 WW domain is shown in panel (c). The mean square displacement (MSD) as a function of time of the first five PCs for FBP28 WW domain at 340K is shown in panel (d). The black, red, green, blue and pink solid lines in panel d correspond to MSDs along the first, second, third, fourth, and fifth PCs, respectively. The black dashed and dash-dot lines correspond to t0.5 and t1, respectively.
