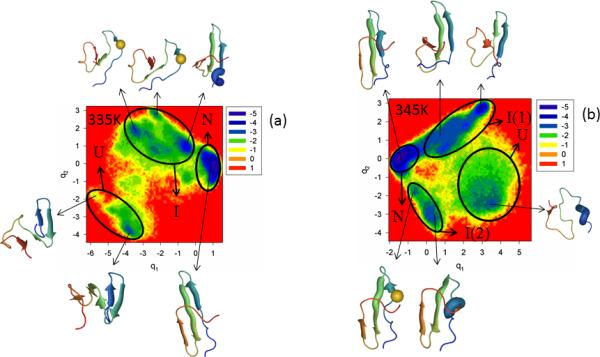
Figure 3.

The free-energy landscape (in kcal/mol) along the first two PCs with representative structures at the minima for folding MD trajectories for the Y11R full-size mutant at 335K is shown in panel (a) and for 345K in panel (b). The letters “U”, “I”, and “N” correspond to unfolded, intermediate and native states, respectively. The mutated residue is shown in spherical representation in some representative structures (panels a and b).
