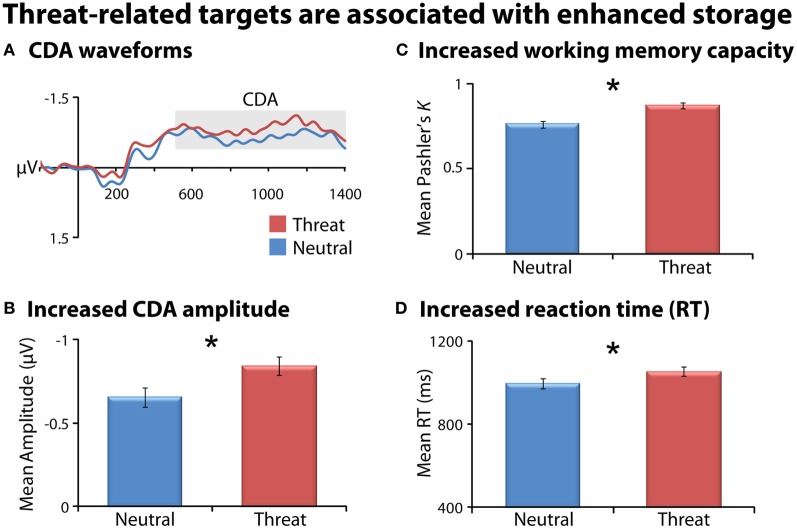
Figure 2.
Task-relevant threat targets are associated with enhanced storage. Means are collapsed across set-size (NT1/NT2 and FT1/FT2). Contralateral delay activity (CDA) waveforms (panel A). Mean CDA amplitude was extracted using the entire delay interval (500–1400 ms; gray box). Threat (red) was associated with increased CDA amplitude (panel B), working memory capacity (panel C), and reaction time (RT; panel D) compared to neutral (blue). Asterisks denote significant pairwise mean differences (p < 0.05). Error bars indicate the nominal probability of the null hypothesis being rejected by chance: p < 0.05 (non-overlapping bars) or p > 0.05 (overlapping bars). Bars were computed as described in Shackman et al. (2010). Note that for CDA results, negative is plotted up corresponding to increased amplitude.

