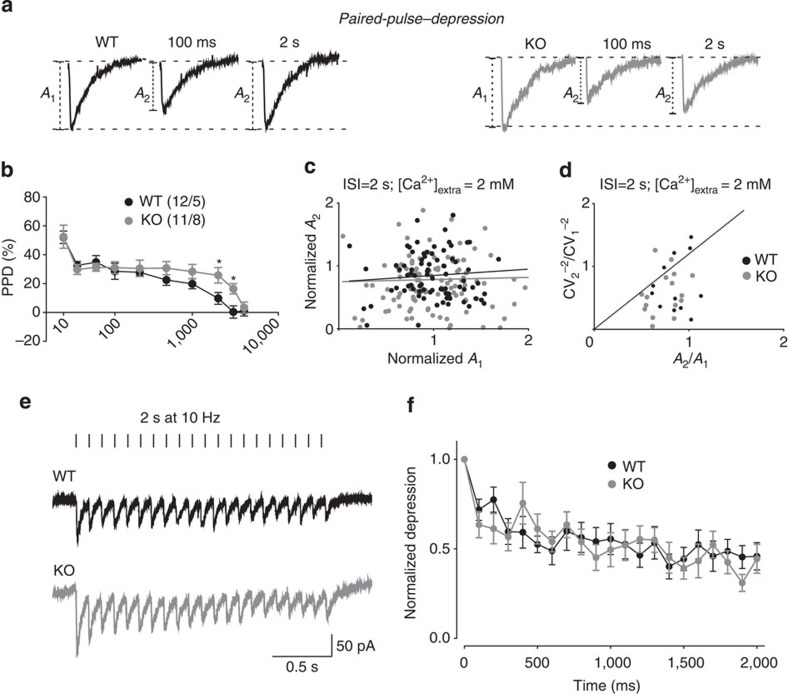
Figure 2. Syn II deletion does not induce major changes in short-term plasticity at inhibitory synapses.
(a) Representative dual eIPSCs traces recorded from dentate gyrus WT (black) and KO (grey) neurons in response to paired stimulation of the medial perforant path at the indicated ISIs. (b) The mean per cent (±s.e.m.) PPD observed in WT (black symbols; n=8–12) and KO (grey symbols; n=6–13) neurons is plotted as a function of the ISI. (c) Plot of the amplitude of the response to the second pulse (A2) versus the amplitude of the response to the first pulse (A1) (10 responses/neuron from n=13 KO and 12 WT neurons,) at 2-s ISI in 2 mM Ca2+. Both amplitudes are normalized to the mean A1 in the recorded ensemble. Linear regression analysis of the data points (black and grey lines for WT and KO, respectively) shows no significant correlation between A1 and A2. (d) The inverse of the square coefficient of variation (CV−2) of the second IPSC (A2) normalized by the CV1 of the first IPSC (A1) was plotted against the PPR (A2/A1) (n=12 and n=16 pairs of WT and KO neurons stimulated at 2 s ISI, respectively). Note that most of the data points of both WT and KO neurons fall below the unitary line, indicating a presynaptic mechanism of short-term depression. (e) Representative traces from WT (black) and KO (grey) in response to stimulation of the medial perforant path for 2 s at 10 Hz. (f) Plot of normalized peak amplitude (±s.e.m.) versus time showing the multiple-pulse depression at 10 Hz in WT (black) and KO (grey) neurons.

