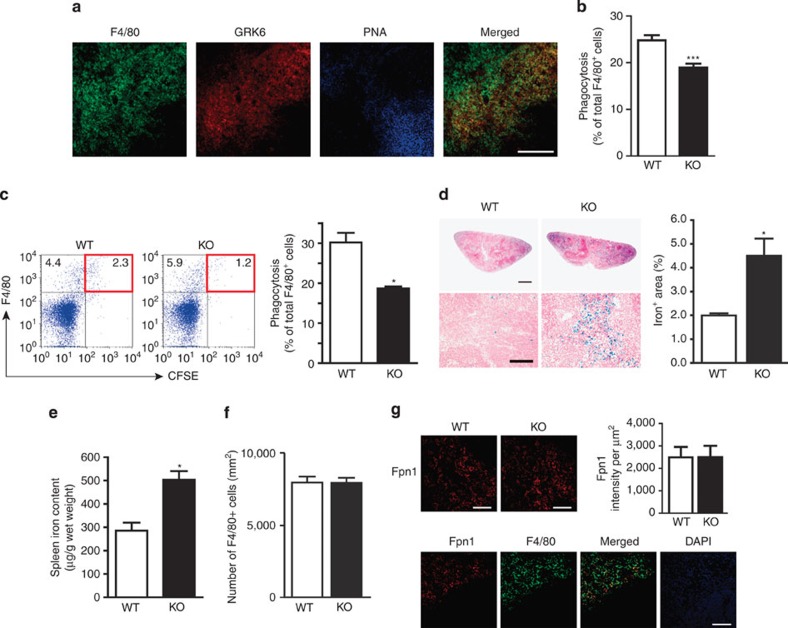
Figure 6. GRK6-deficient mice manifest iron accumulation in splenic red pulp.
(a) Spleen sections from WT mice were stained with anti-F4/80 antibody (green), anti-GRK6 antibody (red) and peanut agglutinin (PNA) (blue). The fourth column is the merged image of F4/80 and GRK6. Scale bar, 100 μm. (b) Splenic cells from WT and GRK6-deficient mice (1 × 10⁶ per well) were co-cultured with CMFDA-labelled apoptotic red blood cells (4 × 10⁷/well) for 90 min at 37 °C. Percentage of F4/80-positive cells carrying the engulfed red blood cells was determined by FACS analysis and shown in the graph. Error bars represent the mean±s.e.m. n=4. (c) Carboxyfluorescein diacetate succinimidyl ester (CFSE)-labelled apoptotic red blood cells were injected to WT and GRK6-deficient mice from tail vein. Percentage of F4/80+ splenic macrophage carrying the labelled red blood cells was evaluated by FACS. All numbers within FACS profiles correspond to the percentage of cells within each region. Error bars represent the mean±s.e.m. n=3. (d) Spleen sections from 16-week-old WT and GRK6-deficient mice were stained with Perl’s Prussian blue to visualize the iron deposits. Scale bar, 300 μm. Enlarged images are shown in the lower column. Scale bar, 100 μm. Areas positive for iron staining were quantified and showed as a percentage of the total surface area of the field. The average numbers are shown with s.d. n=3. (e) Iron levels of spleens from 16-week-old WT and GRK6-deficient mice on a standard diet were determined. Error bars represent the mean±s.e.m. n=5. (f) The numbers of F4/80+ macrophages in the splenic red pulp were counted in WT and GRK6-deficient mice. The numbers (cells per mm2) were determined by four different fields (0.045 mm2) of spleen sections from WT and GRK6-deficient mice. Error bars represent the mean±s.e.m. n=3. (g) Spleen sections from WT and GRK6-deficient mice were stained with anti-ferroportin-1 (Fpn1) antibody. Fpn1 signal intensity in red pulp areas was determined and showed in the graph. Error bars represent the mean±s.e.m. Representative images of Fpn1 (red) and F4/80 (green), the merged and 4',6-diamidino-2-phenylindole (DAPI) images are shown. n=4. Scale bar, 50 μm. *P<0.05 and ***P<0.001. KO, knockout.

