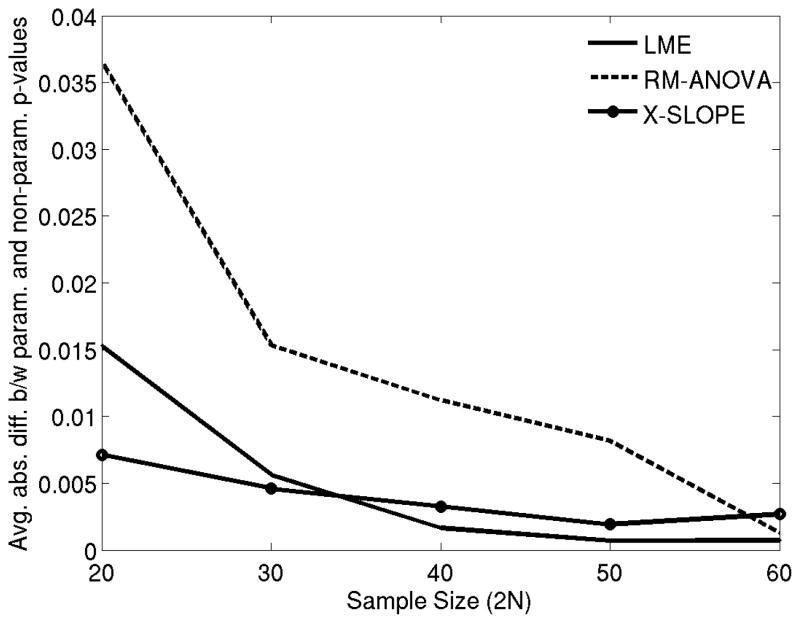
Figure 5.
The mean absolute difference between non-parametric and parametric p-values for three statistical methods in comparing hippocampal volume loss rates between healthy controls (HC) and Alzheimer patients (AD) (Experiment 3) as a function of total sample size. LME: Linear Mixed Effects model with random intercept and slope. Rm-ANOVA: random effects ANOVA. X-Slope: GLM-based cross-sectional analysis of annualized rate of atrophy (slope).

