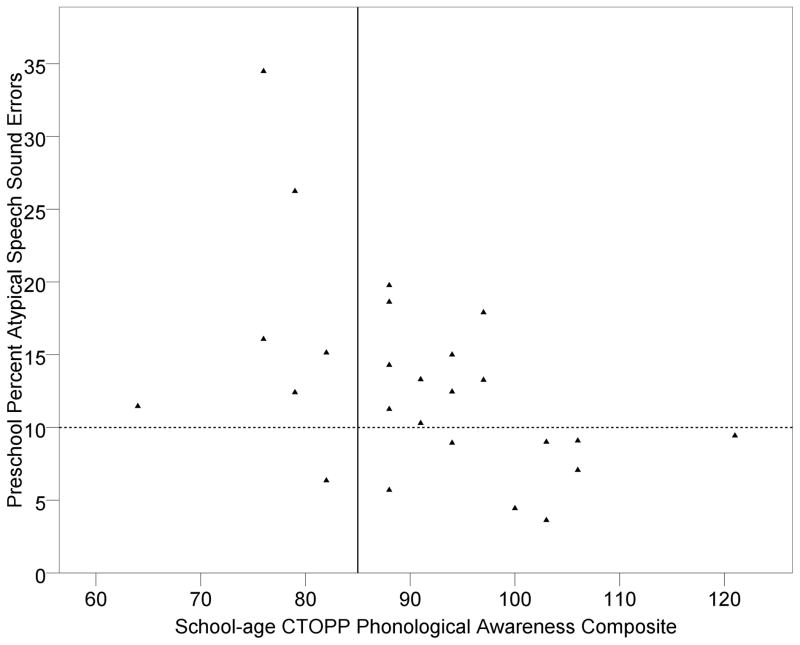
Figure 1. Relationship between preschool Percent Atypical Speech Sound Errors and school-age Phonological Awareness.
Notes: Solid vertical line represents a standard score of 85 (1 SD below the mean). Dashed horizontal line represents 10% of preschool errors classified as Atypical Speech Sound Errors, based on a 125 item picture naming task. CTOPP = Comprehensive Test of Phonological Processing.

