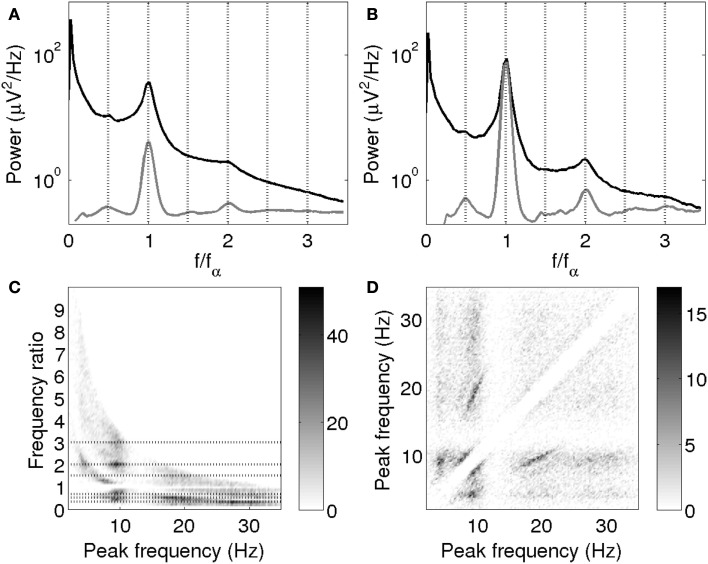
Figure 10.
(A,B) Mean empirical spectrum (black) and fitted peaks (gray) vs. f/fα. (A) All subjects for which alpha peak parameters were obtained. (B) The 10% of subjects with the highest alpha peak amplitudes. Fitted peaks are scaled for clarity, with the same scale in (A,B). (C) Ratios of all pairs of peak frequencies within spectra. Dotted lines are drawn at 1/3, 1/2, 2/3, 3/2, 2, and 3. (D) Pairs of peak frequencies within spectra. The grayscales indicate the density of points. The empty diagonal band reflects the omission of the 1:1 points and the separation necessary for peak resolution.

