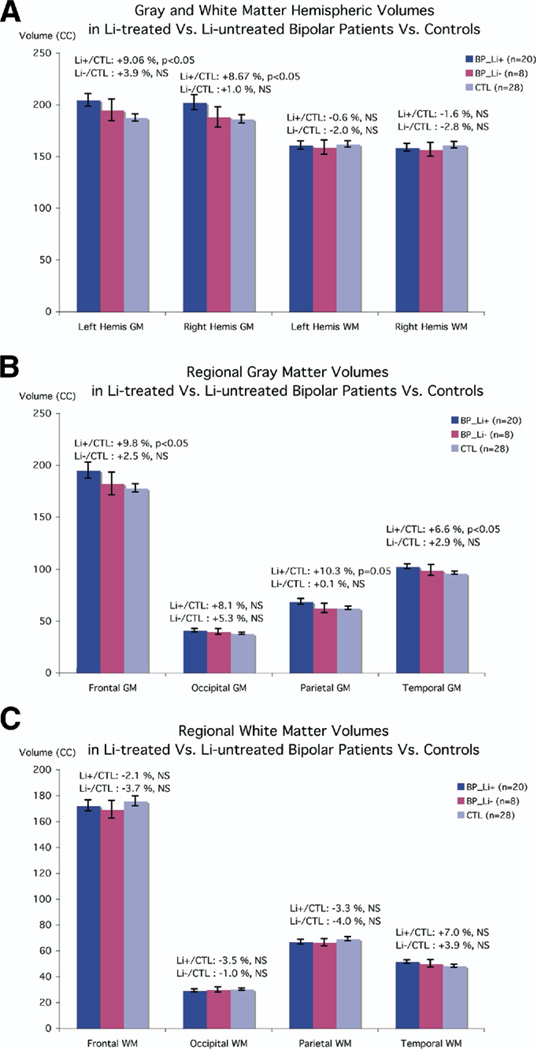
Figure 3.
Comparison of brain volumes in lithium-treated versus untreated patients with bipolar disorder and healthy control subjects. Means and standard error measures (error bars) are shown for the three groups (Li+, Li−, and control subjects), for gray and white matter volumes of the left and right cerebral hemispheres (A), lobar gray matter (B), and lobar white matter (C). There were no differences in white matter volume between the groups, but lithium-treated bipolar patients had significantly greater gray matter volumes (9.1%, left; 8.7%, right), although patients not on lithium did not differ from normal control subjects (A). In addition, lobar gray matter volumes were significantly increased in lithium-treated bipolar patients versus control subjects (B), whereas lobar white matter volumes did not significantly differ between Li+, Li−, and control subjects (C). Li+, treated with lithium; Li−, not treated with lithium.

