
Figure 2.
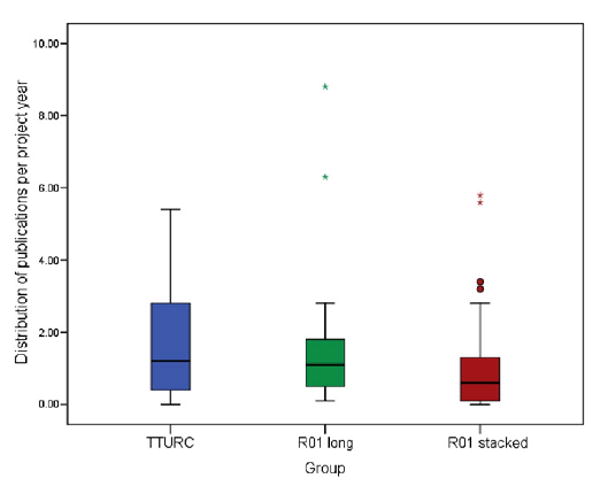
Average number of yearly publications by TTURC subprojects and R01 grants
Note: The top of the box represents the 75th percentile for that group whereas the bottom of the box represents the 25th percentile for that group. The black line across the center of the box represents the median number of publications for that group (TTURC=1.2; LR01=1.1; SR01=0.6). The whiskers represent the highest and lowest values within the group that are not outliers. The circles represent high-performing outliers with the average number of publications per year falling between 1.5 and 3 IQR (interquartile range) units above the 75th percentile in their group. The asterisks represent extremely high-performing outliers with the average number of publications per year falling more than 3 IQR units above the 75th percentile in their group.
Long, longitudinal; R01, NIH Research Project Grant Program; TTURC, Transdisciplinary Tobacco Research Use Center