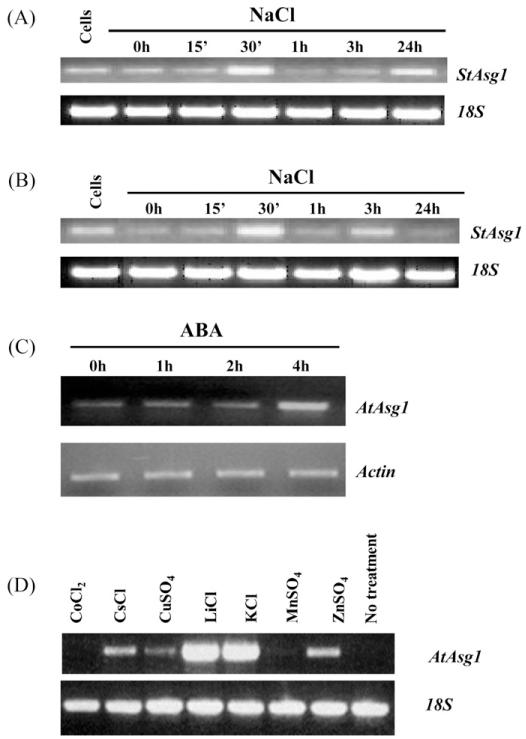
Fig. 1.
Expression analysis of the gene Asg1 in response to treatments by semi-quantitative RT-PCR. Solanum tuberosum Asg1 response to salt treatments (200 mM NaCl) in leaves (A) and roots (B). (C) Time course analysis of Arabidopsis plants treated with ABA 100 μM; (D) 3 h treatments of Arabidopsis 2 week old seedlings grown in liquid culture and treated with different salts; cells: RNAs from S. tuberosum cell cultures were amplified as controls. 18S ribosomal RNA (A, B and D) and β-actin (C) were amplified as internal standards.

