
Figure 2.
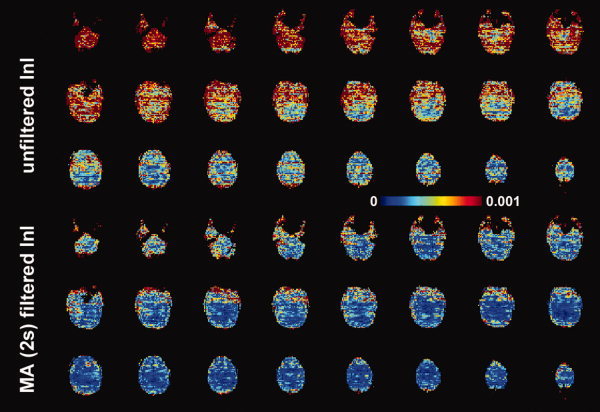
The spatial distribution of baseline noise estimated from the residuals in the GLM model. Axial slice images are shown without filtering and with MA (2 s) filtering. The color encodes the standard deviation of the noise in arbitrary units. [Color figure can be viewed in the online issue, which is available at wileyonlinelibrary.com.]