
Figure 7.
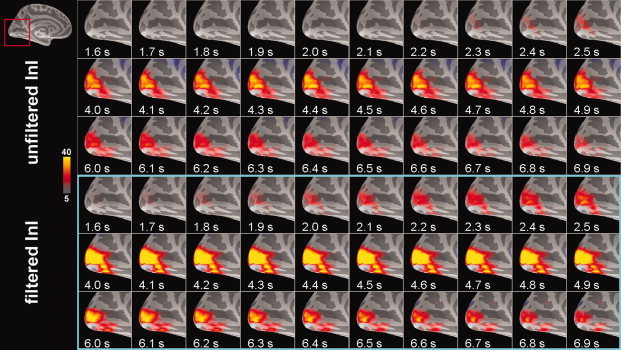
Time series of unfiltered and filtered InI cortical activity reconstructions in the visual cortex in response to visual stimulation from a group of six participants. The critical threshold was z = 5. [Color figure can be viewed in the online issue, which is available at wileyonlinelibrary.com.]