
Figure 8.
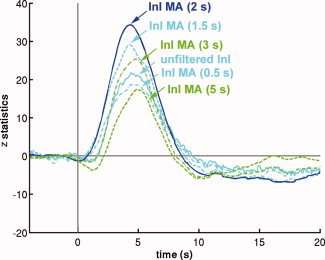
The averaged z‐statistic time course in the visual cortex using unfiltered InI data (solid cyan) and InI data filtered by different moving average filters. InI data filtered with the MA (2 s) filter (solid blue) results in the maximal peak z‐statistic value. [Color figure can be viewed in the online issue, which is available at wileyonlinelibrary.com.]