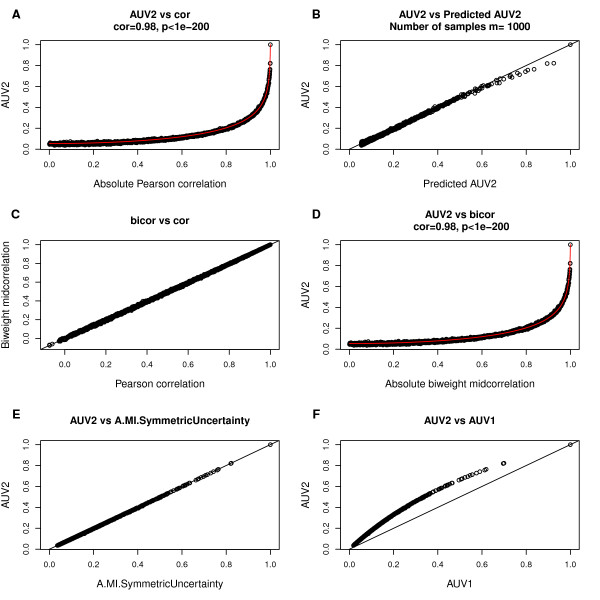
Figure 1.
Relating mutual information based adjacencies to the Pearson correlation and biweight midcorrelation in simulation. Each point corresponds to a pair of numeric vectors x and y with length m = 1000 . These pairs of vectors were simulated to exhibit different correlations. AUV1, AUV2, cor, bicor are abbreviations for AMI,UniversalVersion1, AMI,UniversalVersion2, Pearson correlation and biweight midcorrelation, respectively. (A) MI-based adjacency AMI,UniversalVersion2 versus absolute Pearson correlation. Spearman correlation of the two measures and the corresponding p-value are shown at the top, implying a strong monotonic relationship. The red line shows the predicted AMI,UniversalVersion2 according to Fcor−MI(Eq. 18). Note that the prediction function is highly accurate in simulation. (B) Observed AMI,UniversalVersion2 versus its predicted value. The straight line has slope 1 and intercept 0. (C) Observed Pearson correlation (x-axis) and the corresponding bicor values (y-axis). The straight line has slope 1 and intercept 0. These 2 measurements are practically indistinguishable when x and y are normally distributed. (D) AMI,UniversalVersion2 versus bicor. Spearman correlation and p-value of the 2 measurements are presented at the top, and predicted AMI,UniversalVersion2 are shown as the red line. (E) AMI,UniversalVersion2 versus AMI.SymmetricUncertainty. (F) AMI,UniversalVersion2 versus AMI,UniversalVersion1.

