
Figure 3.
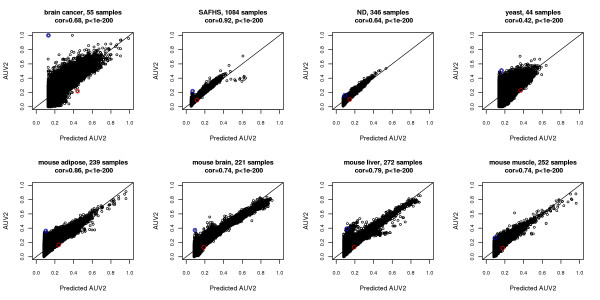
Comparison of predicted and observed AMI,UniversalVersion2 in 8 empirical data sets. In all data sets, prediction from bicor based on Eq. 18 and observed AMI,UniversalVersion2 are highly correlated (the Pearson correlation and corresponding p-value shown at top). Line y=x is added. Blue and red circles have the same meaning as in Figure 2.