Figure 1.
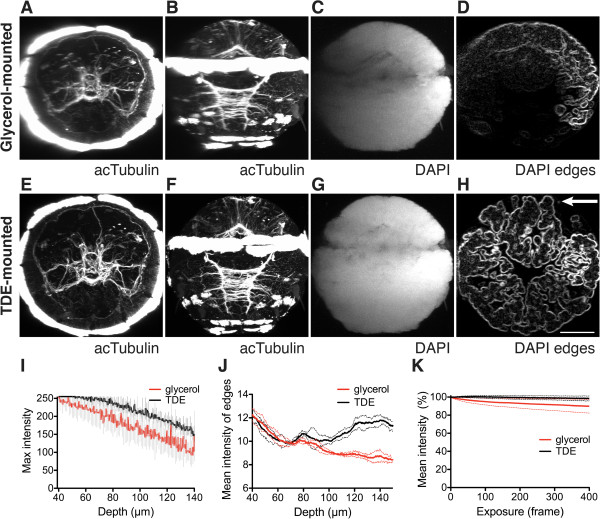
Whole-body confocal scans of Platynereis larvae mounted in glycerol or TDE. (A-D) Lateral scan of a 48 hpf larva stained for acetylated-tubulin and DAPI, mounted in glycerol. (E-H) Lateral scan of a 48 hpf larva stained for acetylated-tubulin and DAPI, mounted in TDE. (D, H) Edges detected with FeatureJ Edges are shown in an orthogonal slice of the DAPI channel. (A and E) are anterior views, (B-D, F-H) are ventral views. (I) Decay of the maximum intensity value in the DAPI channel along the depth of the image stack in glycerol and TDE. (J) Decay of the average DAPI edge signal detected with FeatureJ Edges along the depth of the image stack in glycerol and TDE. (K) Decay of DAPI signal intensity due to bleaching in one optical slice throughout exposure time in glycerol and TDE. For (I-K) mean and standard deviation are shown, n = 3 larvae. Arrow in (H) indicates the direction of scan for (A-H). Scale bar: 50 μm. hpf, hours post fertilization; DAPI, 4’,6-diamidino-2-phenylindole; TDE, 2,2’-thiodiethanol.

