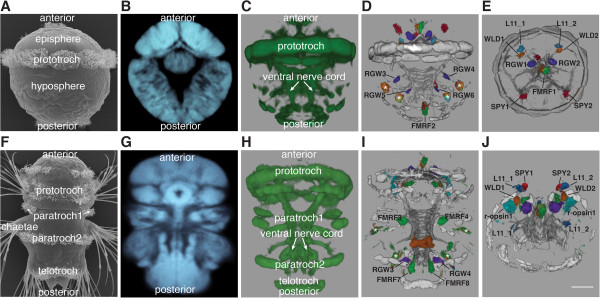
Figure 3.

Average templates with aligned gene expression patterns in 48 hpf and 72 hpf Platynereis larvae. Scanning electron microscopic image of a 48 hpf trochophore (A) and a 72 hpf nectochaete (F) Platynereis larva. Average nuclear-stain templates for 48 hpf (B) and 72 hpf (G) larvae and tubulin templates for 48 hpf (C) and 72 hpf (H) larvae. Average gene expression patterns and acetylated tubulin were registered to the nuclear-stain templates for 48 hpf (D, E) and 72 hpf (I, J) larvae. (A-D, F-I) are ventral views, (E, J) are anterior views. The cells that were used for the quantifications are labeled. White asterisks in D and I indicate the autofluorescent spinning glands in the trunk. Scale bar: 30 μm. hpf, hours post fertilization.
