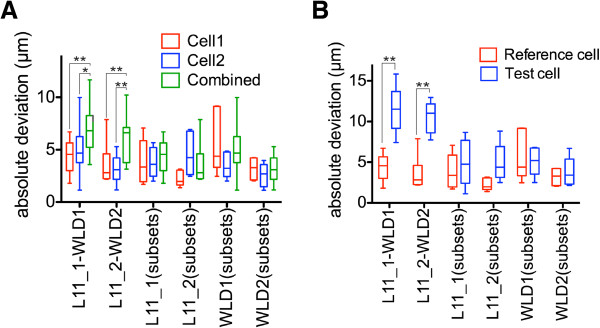
Figure 5.

Colocalization analysis of genes expressed in single cells. (A) Comparison of absolute deviation values of cell center positions for the indicated cell pairs analyzed alone or combined together. (B) Comparison of absolute deviation values of cell center positions for a ‘reference cell’ and a ‘test cell’ relative to the ‘reference cell’ average. Coexpressed genes were simulated by splitting the images for the same gene into two subsets (a ‘reference’ and a ‘test’ set). The cells and their identifiers are shown in Figure 3. P values of an unpaired t-test are shown: *P <0.05, **P <0.01.
