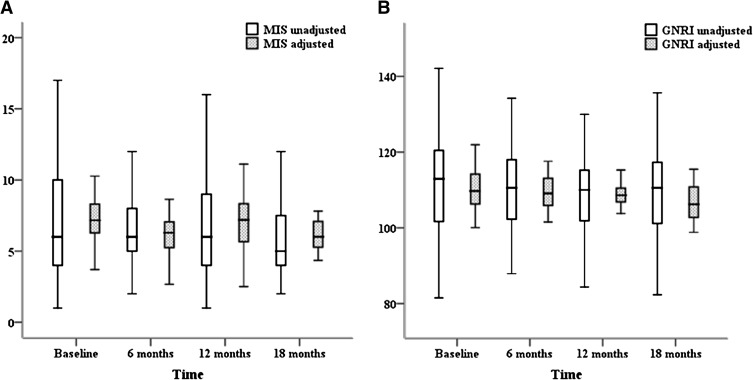
Figure 3.
Box and whisker plots of MIS and GNRI measurements at baseline (month 0) and at 6-month intervals in the study population. (A) MIS shows a trend for decrease with time. (B) GNRI decreases significantly with time in both univariate and multivariate analyses. MIS, malnutrition-inflammation score; GNRI, geriatric nutritional risk index.

