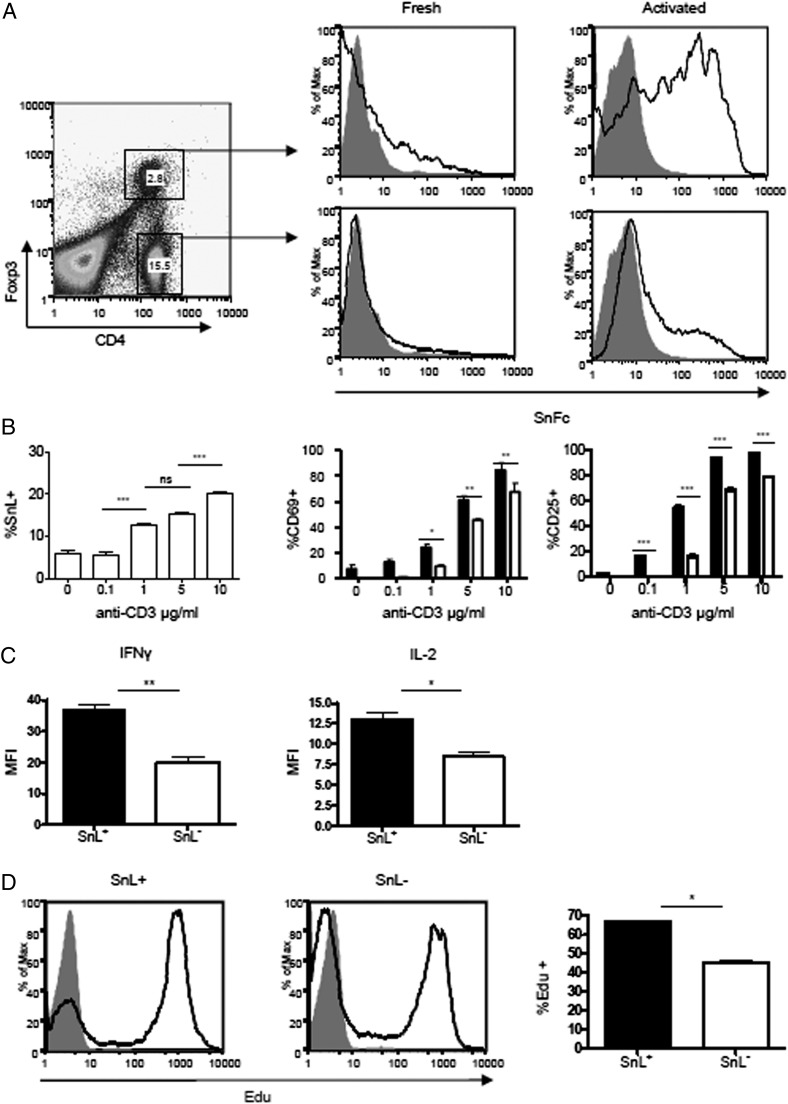
FIGURE 1.
Upregulation of SnL on CD4+ T cells. (A) Splenocytes from C57BL/6 mice were activated with plate-bound anti-CD3 (5 μg/ml) for 72 h and compared with freshly isolated splenocytes for the expression of SnL. Intracellular staining for Foxp3 was undertaken to examine SnL on both Tregs and Teffs in both freshly isolated and activated groups. Dot plots of activated splenocytes stained for CD4 and intracellular Foxp3. CD4+Foxp3+ (Tregs) and CD4+Foxp3− (Teffs) are gated with percentages of total splenocytes shown for each gate. Histograms of SnL expression (black lines) and sialidase-treated controls (solid gray) are presented. (B) SnL+CD4+ T cells display a higher state of activation following TCR ligation compared with SnL−CD4+ T cells. Percentages of CD69+ and CD25+ on SnL+ (black bars) and SnL− Teffs (unfilled bars) following 48 h of stimulation with different concentrations of plate-bound anti-CD3. Data represent means ± SEM of triplicate samples for each anti-CD3 titration. Data are representative of three independent experiments. Statistical analysis was done using two-way ANOVA with Bonferroni posttest analysis. (C) Intracellular cytokine expression in SnL+ and SnL− Teffs. MACS-sorted CD4+CD25− T cells from three C57BL/6 mice were activated with anti-CD3/CD28 beads for 48 h to induce SnL. Activated cells were restimulated with PdBU and ionomycin in the presence of brefeldin A (as described in Materials and Methods). Following surface labeling with Sn–Fc, intracellular staining for IFN-γ and IL-2 was carried out. (D) SnL+ Teffs display a hyperproliferative response following TCR ligation. CD4+CD25− T cells were activated with anti-CD3/CD28 beads for 72 h. EdU was added at 10 μM in the last 12 h of culture. Histograms represent EdU expression on SnL+ (left panel) and SnL− (middle panel) as compared with resting unstimulated Teffs (solid gray histogram). Bar graph (right panel) shows the percentage of EdU+ cells in SnL+ (black bar) and SnL− (unfilled bar). Data represent means ± SEM of triplicate samples. *p < 0.05, **p < 0.01, ***p < 0.001.

