Figure 1.

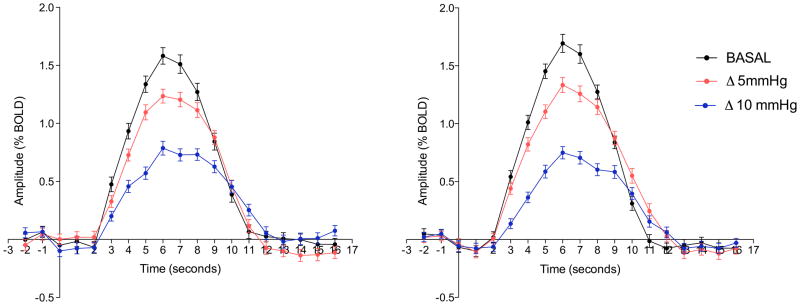
Mean group BOLD time course for the right (A) and left (B) auditory cortex on the three ETCO2 conditions: in black the basal condition, in red during an increase of 5mmHg on the ETCO2 and in blue during an increase of 10mmHg on the ETCO2.

Mean group BOLD time course for the right (A) and left (B) auditory cortex on the three ETCO2 conditions: in black the basal condition, in red during an increase of 5mmHg on the ETCO2 and in blue during an increase of 10mmHg on the ETCO2.