
Figure 1.
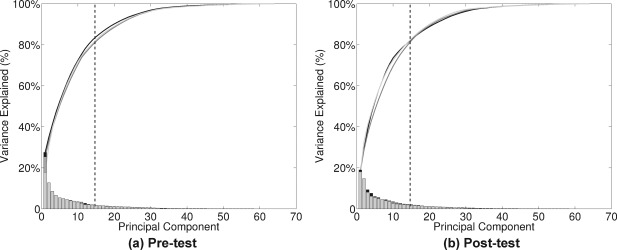
Scree plots of PCA for each test session [(a) pre‐test and (b) post‐test] and each practice group. Each curve represents one of the practice groups (antisaccade, prosaccade, or fixation), and the heights of the vertical bars on the bottom represent the contributions of each PC for that group. Note that there are little differences across the groups so that lines are indistinguishable. On the basis of these plots, we selected 15 PCs (dashed vertical line) because they explained at least 80% of the total variance.