
Figure 3.
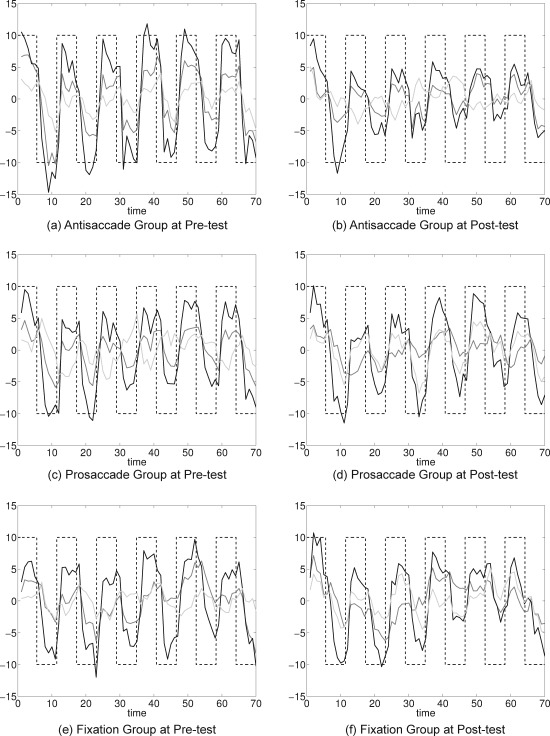
Three clusters (cluster 1 is shown in black, cluster 2 is shown in dark gray, and cluster 3 is shown in light gray) for pre‐test and post‐test for antisaccade (a, b), prosaccade (c, d), and fixation groups (e, f). Black dashed lines represent the stimulus timing with values on the x‐axis being the number of whole‐brain collections (TRs) across time.