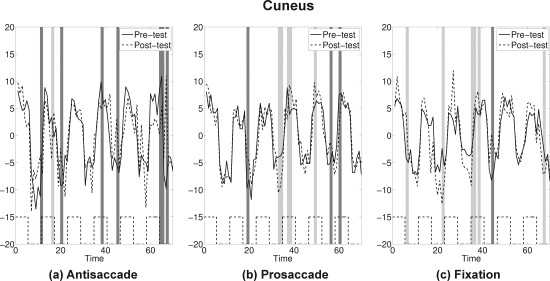
Figure 10.

Cuneus: The average time series plots for pre‐test (solid) and post‐test (dashed) are drawn for the three practice groups. Black dashed lines at the bottom show the timing of antisaccade task blocks. Dark gray bands represent time points where attenuations at post‐test were statistically significant, and light gray bands represent time points where amplifications at post‐test were statistically significant by the bootstrap resampling method.
