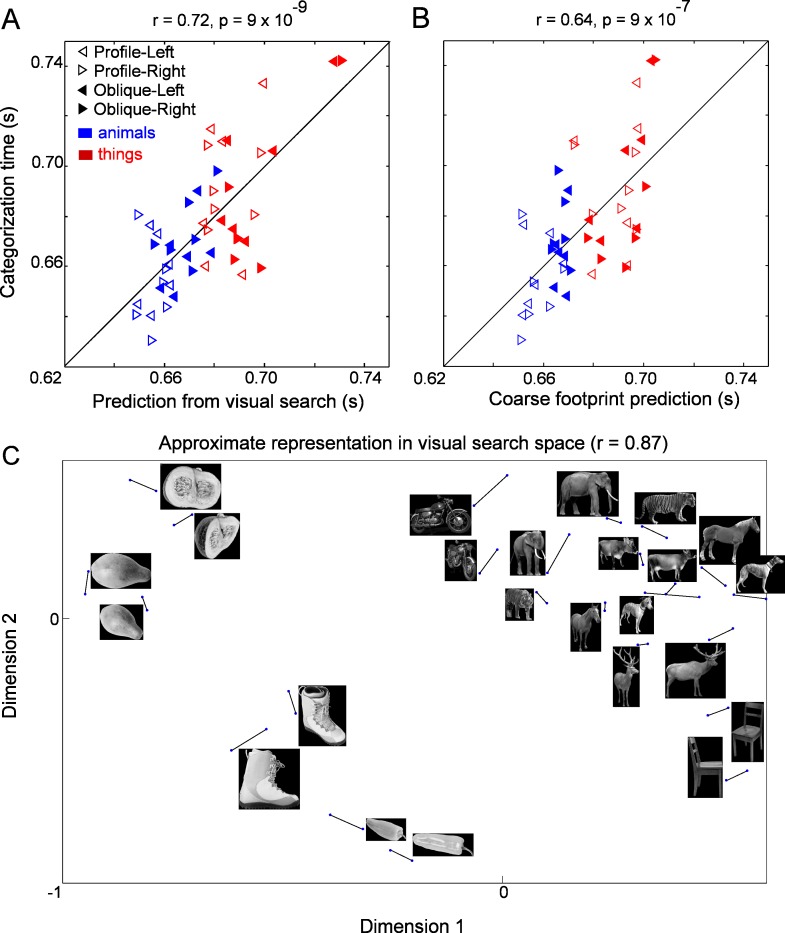
Figure 4.
Animal categorization task with objects varying in three-dimensional view (Experiment 2). Subjects were asked to categorize an object as an animal or not as before, except that the objects consisted of animals or nonanimals in four possible three-dimensional views: two profile views (pointing left or right) and two oblique views (pointing left or right). (A) Correlation plot of categorization times for each item (averaged across subjects) versus predictions using search data; different shapes represent the reaction times for animals in the four different views (profile/oblique left/right); blue represents reaction times of all animals, and red represents reaction times of all things. (B) Correlation plot of observed categorization times versus predictions using the coarse structure model with conventions as in Figure 4A. (C) Approximate representation of animals and nonanimals in visual search space. Dots represent all 48 images. Dots connected by a line represent pairs of images that are identical short of mirror reflection. All images are to scale except for the cow images, which are scaled down by 80% to accommodate them in the plot.

