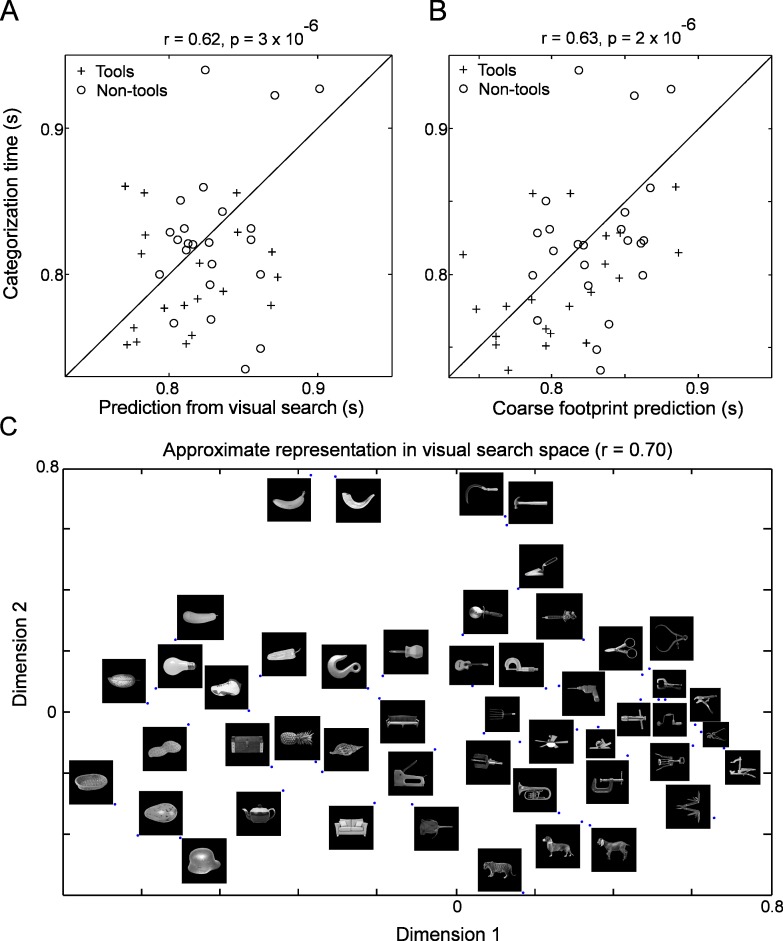
Figure 6.
Tools categorization task (Experiment 4). Subjects were asked to categorize an object as a tool or not. (A) Correlation plot of categorization times for each item in the tools task against predictions using visual search data. Plus symbols represent reaction times of all tools, and circles represent reaction times of all nontools. (B) Correlation between observed categorization times in the tools task against predictions using coarse footprint with the same conventions as in Figure 6A. (C) Approximate representation of tools and nontools in visual search space, showing separable clusters according to category. Some images are scaled down to accommodate them in the plot.

