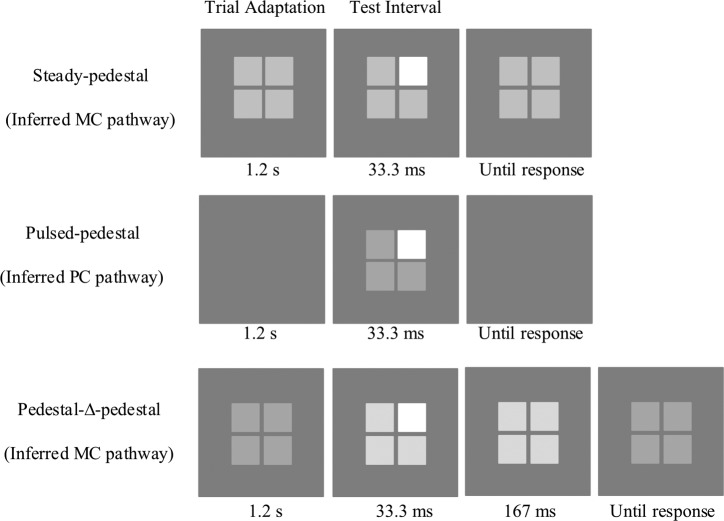
Figure 1.
Diagrams of the stimulus displays for the steady pedestal (top panel), the pulsed pedestal (middle panel), and the pedestal-Δ-pedestal (bottom panel) paradigms. The pedestal consisted of a 2 × 2 array of four 1° squares (separated by 0.08°) surrounded by a uniform achromatic 32.8° × 22.3° rectangular field of 15.0 cd/m2. The experiment started with a 1-min adaptation to the background luminance and a 5-s additional adaptation to each pedestal luminance for the steady-pedestal or pedestal-Δ-pedestal paradigm. The three paradigms were similar in the test interval but differed in the adaptation phase. For the steady pedestal and pedestal-Δ-pedestal paradigms, there was 1.2 s adaptation to pedestal luminance for each trial; for the pulsed pedestal paradigm, however, the adaptation was to the background luminance. During the 33.3 ms test interval of each trial, one randomly selected square had a higher luminance from the other three squares that had the pedestal luminance for the steady pedestal and pulsed pedestal paradigms or the pedestal-Δ-pedestal luminance for the pedestal-Δ-pedestal paradigm. Participants were instructed to identify which square differed from the others during the test interval. For the pedestal-Δ-pedestal paradigm, after the test interval, the squares maintained the pedestal-Δ-pedestal luminance for an additional 167 ms before it returned to the pedestal luminance.

