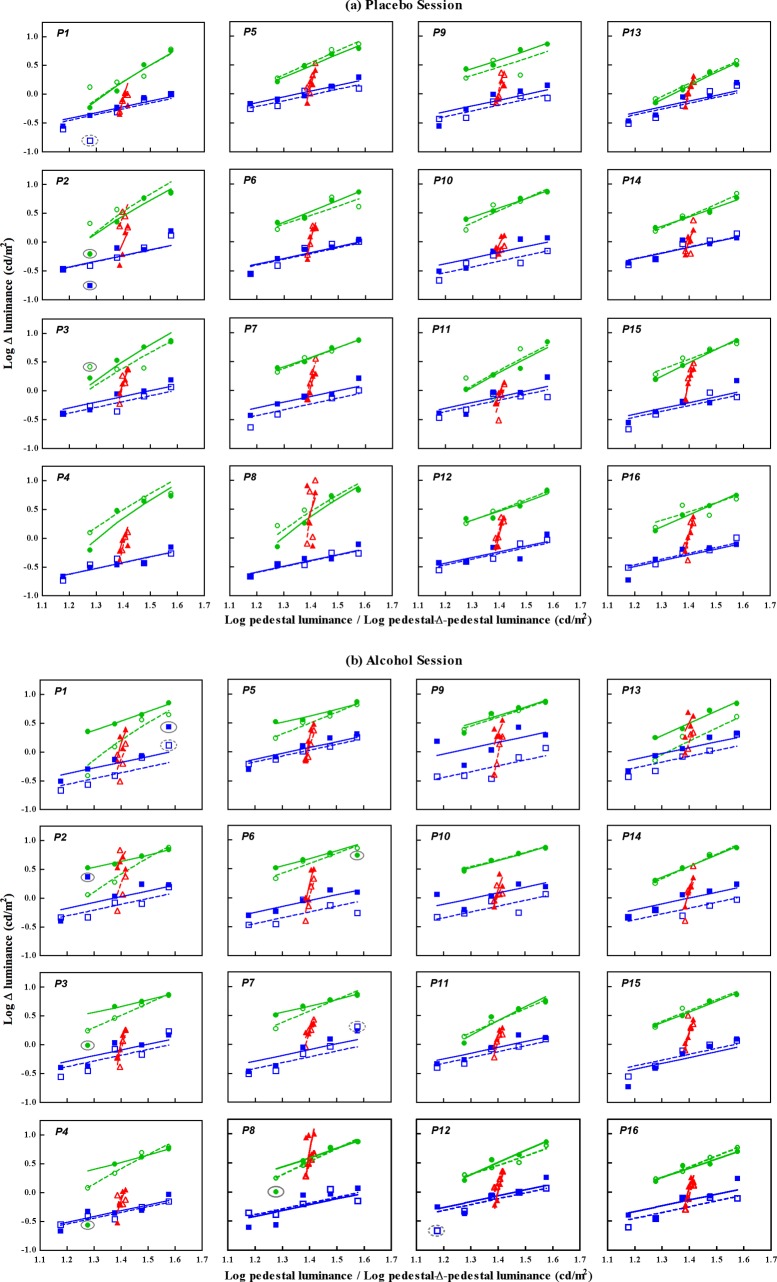
Figure 3.
Individual contrast detection and discrimination thresholds and model fits from the pre- and postbeverage testing conditions in the (a) placebo sessions and (b) alcohol sessions. Each panel has the same format as Figure 2. The individual data are presented in an order based on the pattern and magnitude of the slope change in the pulsed-pedestal function in the alcohol session. The first two columns show the individual data that are consistent with the account of increase in neural noise, and the panels are ordered by the change magnitude from large to small. The last two columns show the individual data with smaller or minimal change. The data points encircled in the solid (for the postbeverage session) and dashed (for the prebeverage session) ovals were excluded from model fits for the reason described in the Methods section.

