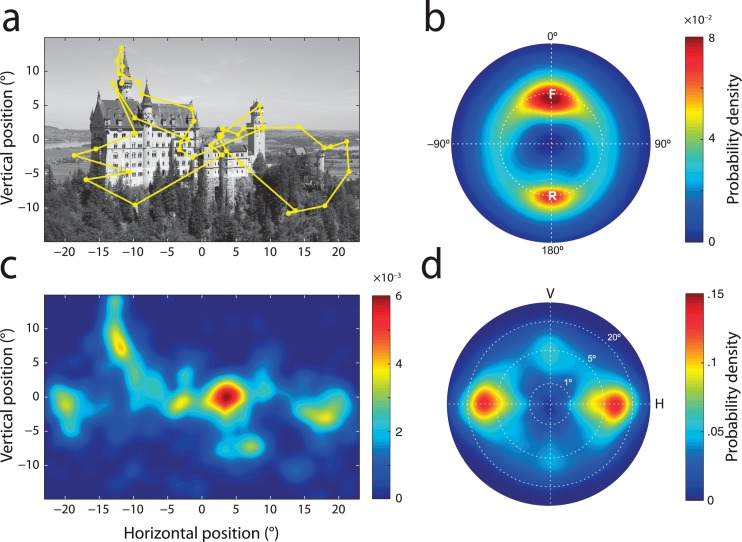
Figure 1.
Gaze statistics in free-viewing of natural scenes. (a) One of the experimental images, overlaid with a typical scanpath (sequence of fixations and saccades) recorded during free-viewing. Images were full-color but shown here in grayscale for clarity. (b) Heat map on a polar plot showing the distribution of relative saccade metrics in free-viewing data. Hotter colors indicate greater probability density. Position on the circle indicates the angular difference between two successive eye movements. Here, 0° corresponds to a saccade in the same direction as the one before, i.e., the ‘forward' direction. Positive values indicate clockwise deviation. 180° corresponds to the ‘return' direction. Radial position indicates the difference in amplitude between successive saccades on a logarithmic scale: the dotted circle indicates equality. Note the two peaks corresponding to forward saccades (marked ‘F') and return saccades (marked ‘R'). (c) Probability of fixation as a function of location (fixation density) for all participants viewing the image shown in (a). (d) Probability distribution of saccade amplitude and direction (saccade density) for all participants and images in the free-viewing task shown on a polar plot. Here V corresponds to vertical movements and H to horizontal ones. Radial position indicates saccadic amplitude on a logarithmic scale. Note how most saccades are horizontal and of relatively small amplitude.

