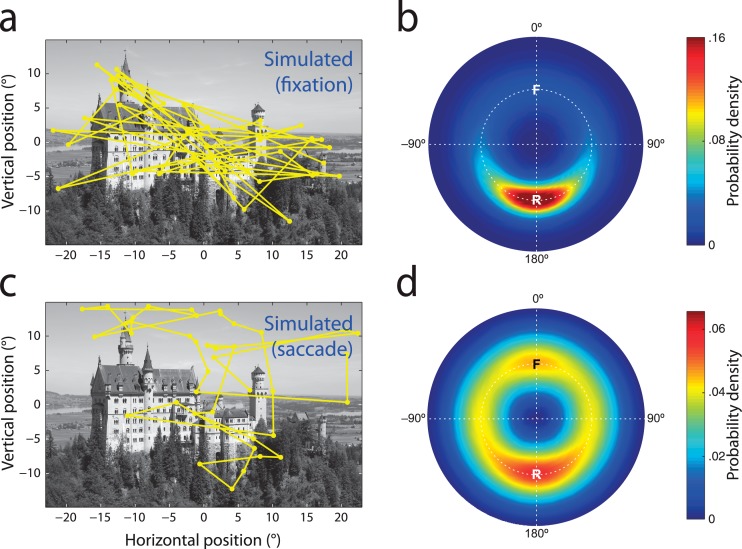
Figure 2.
Attentional and oculomotor biases contribute to return frequency. (a) Typical scanpath generated by random sampling from the fixation density estimated for an example image (Figure 1c). (b) Relative saccade metrics in a large set of simulated scanpaths based on sampling fixation density. Note prevalence of return saccades (R), despite independence in selection of each simulated fixation. (c) Typical scanpath generated by random sampling from the saccade density (Figure 1d) estimated for free-viewing data. (d) Relative saccade metrics in simulated scanpaths based on saccade density. Note prevalence of both return (R) and forward saccades (F), despite independence in selection of each simulated saccade.

