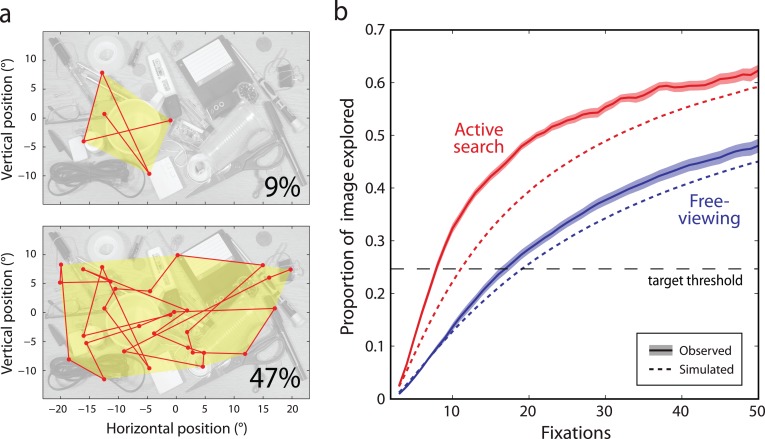
Figure 8.
Memory for gaze history supports exploration in natural vision. (a) Proportion of image area explored at early (top) and late stages (bottom) of search, for a typical scanpath (red). In this example, the area enclosed by the scanpath (yellow shaded area) increases from 9% of total image area after the first five fixations (top) to 47% after thirty fixations (bottom). (b) Proportion of image area explored as a function of number of fixations, in recorded data (solid lines; shaded region indicates ±1 SE) and memoryless simulation (dotted lines). Results for the free-viewing task are shown in blue, search task in red. Horizontal dashed line indicates mean area explored prior to locating target in search task.

