
Figure 6.

Flexible versus canonical models for geometry. (a) Simulations of Wannig et al. (2011) attention data. Cartoons show the stimuli and location of attention. Both the flexible and canonical models capture the larger facilitation for collinear attention in the Wannig et al. (2011) data. (b) Simulations without attention based on Cavanaugh et al. (2002), with cartoons and simulations adjusted to match the Wannig et al. (2011) setup. Only the flexible model captures the greater suppression for collinear than diagonally placed stimuli. Attention weights are set to 2 and 1, respectively, and the additive constant to 0.1. The flexible and canonical models are as in Figure 5, but include a nondiagonal inverse covariance matrix capturing the geometry:
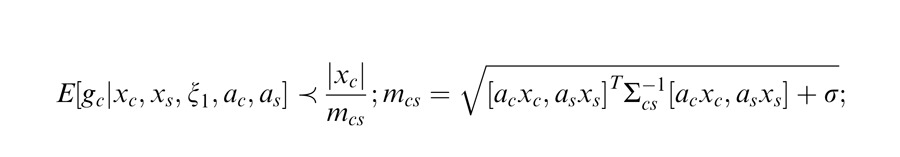 |
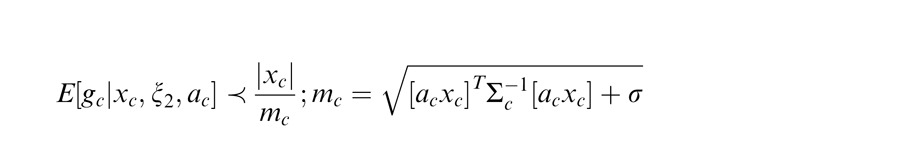 |