Prediction of the flexible versus canonical model for nonoptimal center stimulus and optimal surround stimulus. (a) Predictions of the canonical divisive normalization model. The
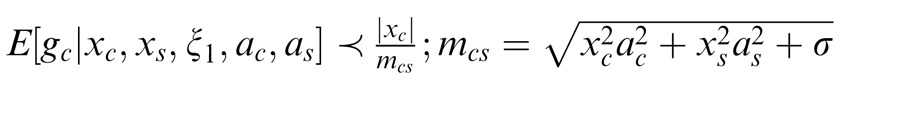
y-axis corresponds to the response modulation by attention, i.e., the response of the model neuron without attention divided by its response with attention. Black and gray solid lines are for an optimally oriented center stimulus and varying the orientation of the surround stimulus. Blue and cyan lines are for an optimally oriented surround stimulus and varying the orientation of the center stimulus. Black and blue lines are for an attention weight set to 3, and gray and cyan lines are for different values of the attention weights. (b) Same but for the flexible normalization pool model. (c) Depicts for the flexible model the estimated (posterior) weights that the surround is in the normalization pool of the center (plotted as the modulation of the estimated weights without attention divided by the estimated weights with attention). Values greater than 1 indicate that attention increased the estimated weights. The flexible model takes a weighted sum of
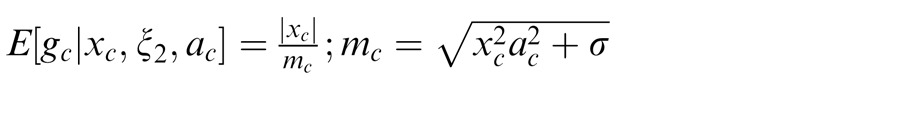
(divide by surround condition) and
(divide only by center condition), with the weighting given by the posterior weights. In the canonical model the weights are set to 1 such that there is always divisive normalization by the surround.