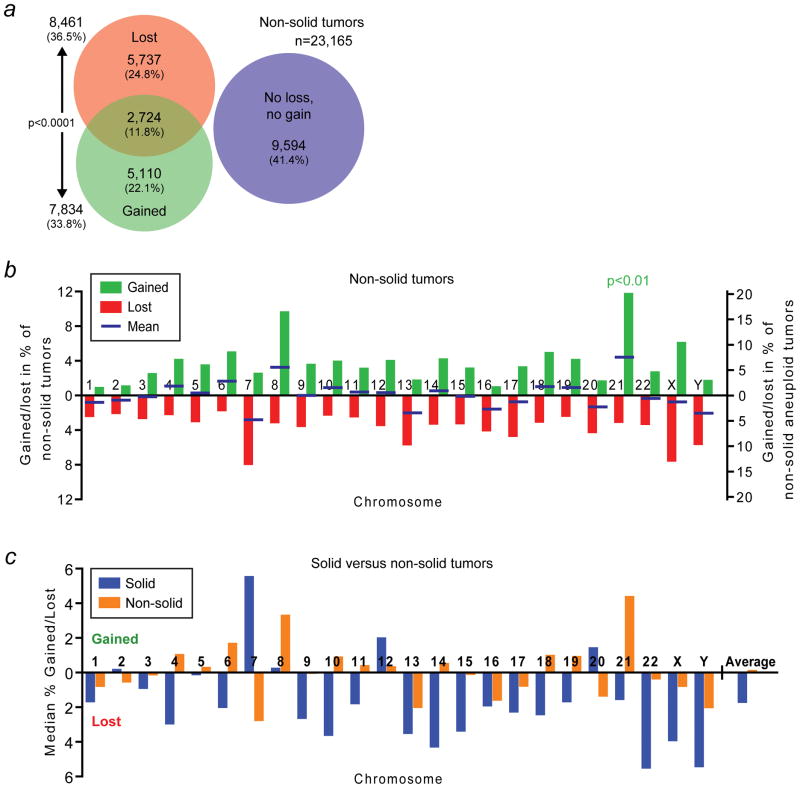
Figure 5.
Human solid and non-solid tumors have markedly different whole-chromosome aneuploidy signatures. (a) Area-proportional Venn diagram as in Figure 1a but for non-solid tumors. (b) Whole-chromosome gain and loss rates for individual chromosomes in non-solid cancers. The blue bars indicate the mean of the gain and loss rates. Chromosome 21 is gained significantly more frequently than any of the other chromosomes (p<0.01; two-sided Grubbs’ test). (c) Comparison of the means of the gain and loss rates of each chromosome for solid (blue) and non-solid tumors (orange). These frequencies represent the respective blue bars in Figures 1b and 5b. Bars above the x-axis indicate a bias towards gain, those below the axis a bias towards loss. The average on the far right corresponds to the average of the plotted gain and negative loss rates of all chromosomes. See also main text for details.

