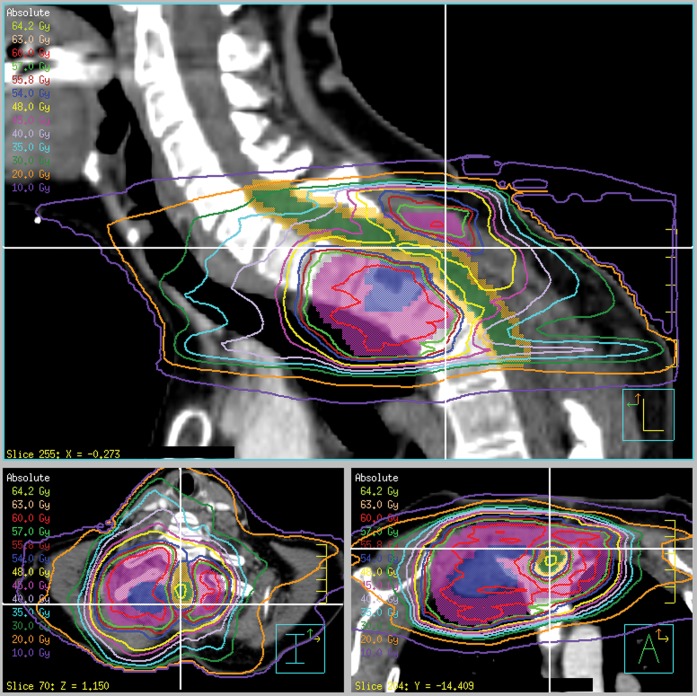
Figure 1.
Sagittal, transaxial and coronal views of the dose distribution. Blue, gross tumour volume; purple, planning target volume; green, spinal cord; orange, spinal cord planning risk volume. The white cross-hairs show the positions of the three orthogonal views. Note the considerable curvature of the patient's neck.

