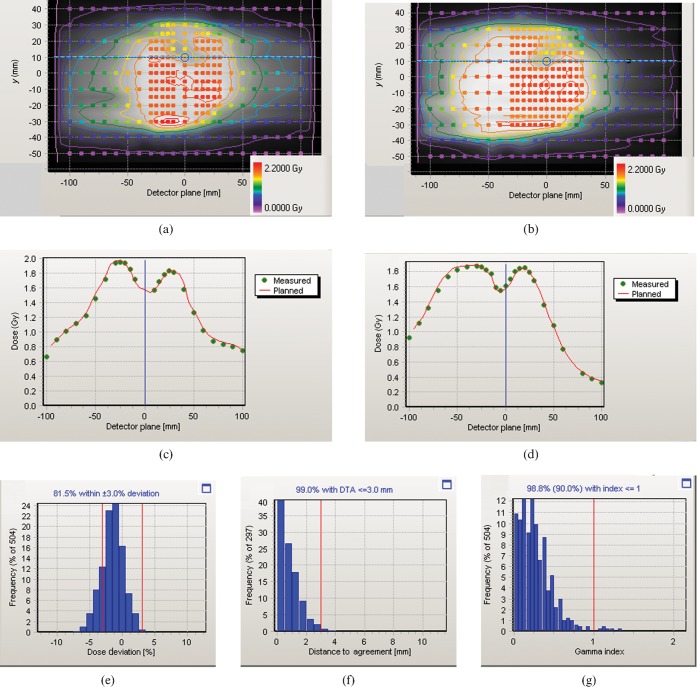
Figure 3.
Delta4 verification results. (a,b) Planned dose distribution recalculated on the verification phantom (greyscale and isodoses), together with the delivered dose distribution (coloured circles) over the two planes of diodes. The colour legends apply to both the planned isodoses and the measured doses. (c,d) Dose profiles through the spinal cord region [see horizontal lines on (a) and (b)], with planned dose shown as a red line and measured dose shown as discrete green points. (e) Histogram of measured dose in relation to planned dose, (f) histogram of distance to agreement and (g) histogram of gamma for 3% and 3 mm, showing that 98.8% of measurements, i.e. greater than the required 90%, have a gamma of less than unity.

