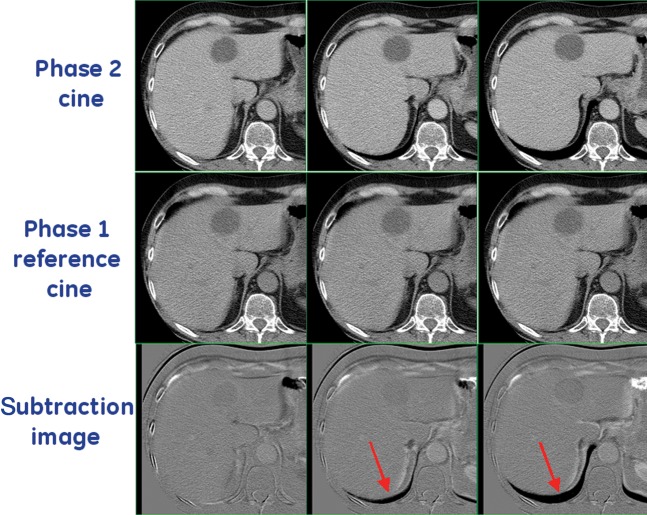
Figure 2.
Top row shows three examples of Phase 2 cine images (acquired at different positions in the breathing cycle). The bottom row shows the subtraction image produced by subtracting the Phase 2 cine images from the reference cine image from Phase 1 (middle row). The subtraction images were presented to the observers to aid in performing manual registrations. Arrows highlight areas of difference between the reference image and the Phase 2 cine images, which can clearly be seen in the subtraction images. In this example, it is clear that the Phase 2 cine in column 1 (bottom left-hand corner) was most similar (or least misregistered) to the reference image.

