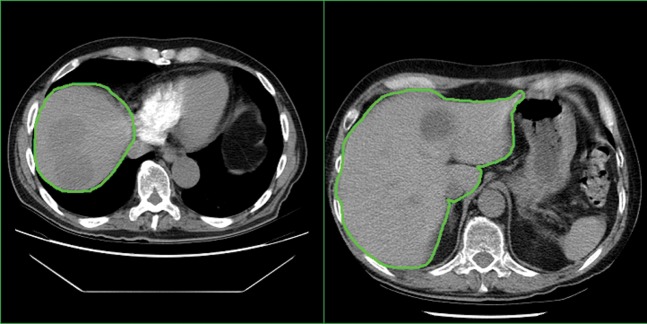
Figure 3.

Examples of slices from Phase 1 cine reference images from two separate patient data sets. The green line in each image shows the rough liver region of interest used to segment the cine reference image before registration. Only intensity values within the region of interest were used during the rigid registration.
