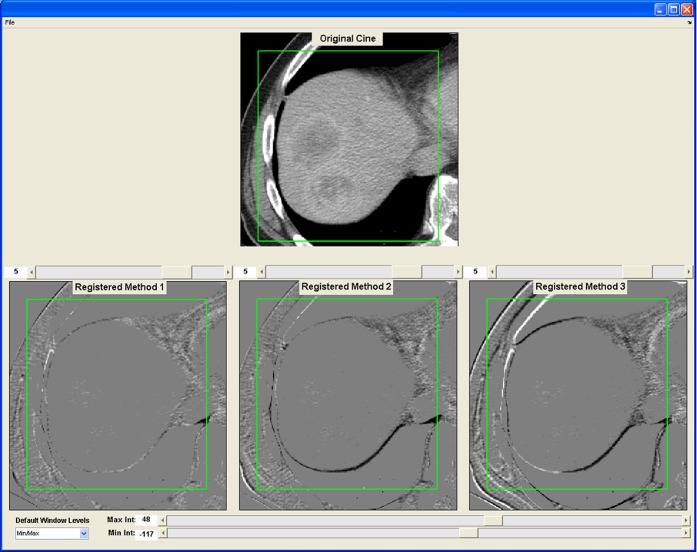
Figure 4.
A snapshot of the graphical user interface developed for the visual validation experiment of the three registration techniques. Top row shows a transverse slice of the reference image from Phase 1. Bottom row shows the subtraction image produced by subtracting the reference image from one of the six registered images for each of the three registration techniques. The three registration techniques were presented to the observer in a random way (“Method 1, 2, 3”). Observers were asked to score the degree of alignment of the liver outline within the green box, using the scoring scale presented in Figure 5. In this example, the registration techniques were non-rigid (left), rigid (middle) and manual (right).

