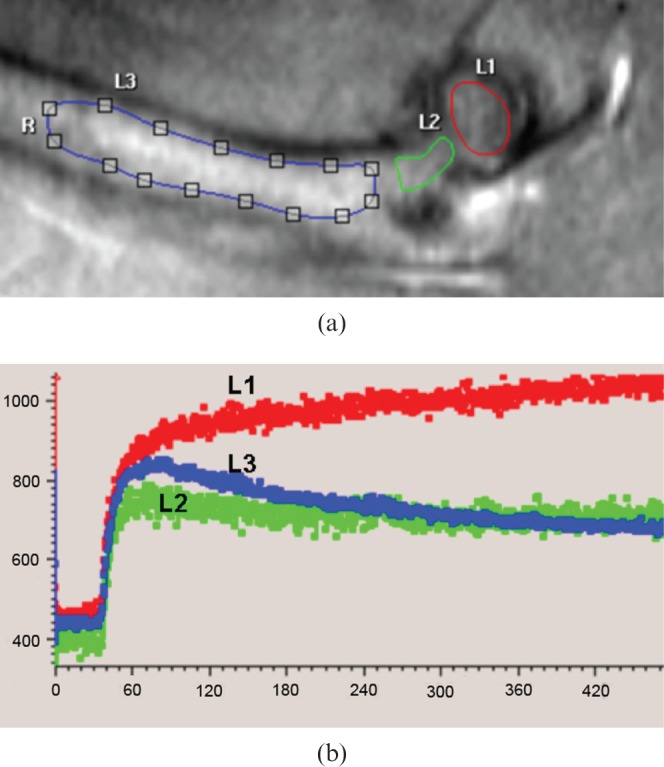
Figure 1.

(a) T1 weighted anatomical image depicting femoral head (L1), femoral neck (L2) and proximal femoral diaphysis (L3). (b) Dynamic contrast-enhanced MRI time–signal intensity curve (y-axis: signal intensity in arbitrary units; x-axis: time in seconds). In the proximal femoral diaphysis, signal intensity curve drops after peak enhancement in proximal femoral shaft (L3, blue line). In contrast, after a rapid rising phase the time–signal intensity curve in the femoral head continues to increase slowly, and no washout is observed 440 s post-contrast injection (L1, red line). The time–signal intensity curve of femoral neck is close to femoral shaft although the washout curve is flatter than that of the proximal femoral diaphysis. R, right (femur).
