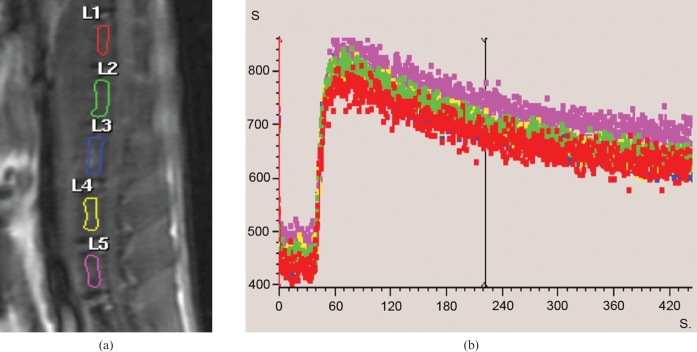
Figure 3.
(a) MRI sagittal view of lumbar spine of a rat. ROIs were drawn over vertebrae L1–L5. (b) Dynamic contrast-enhanced MRI time–signal intensity curves. After bolus injection of Gd-DOTA, all five vertebrae show similar enhancement pattern, with a rapid contrast washin phase followed by a contrast washout phase.

