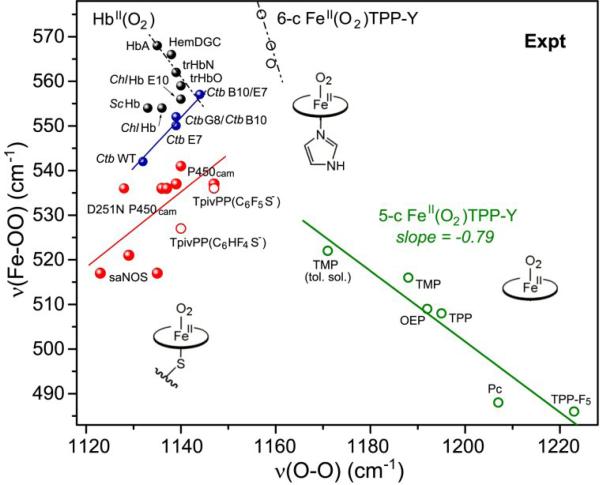
Figure 19.
Experimental data for Fe(II)O2 adducts. Green circles – 5-coordinate adducts (as in Fig. 2); black circles – imidazole-ligated adducts; black dots – histidine-ligated heme proteins, with various distal H-bond interactions; red dots – cysteine-ligated heme proteins; red circles – thiolate-ligated porphyrin adducts. The blue line connects variants of a single protein, Ctb, in which distal H-bond donors are successively replaced. [References to original data can be found in ref.6]

