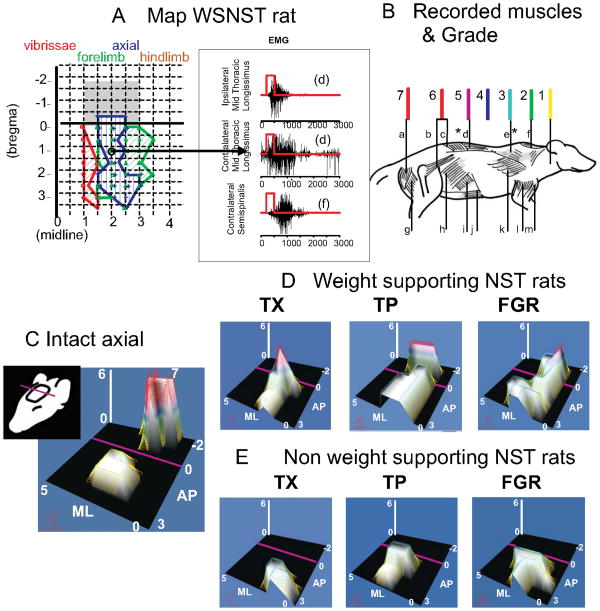
Figure 1.
Trunk representation in intracortical microstimulation (ICMS) maps of cortex is compared across function and intervention in NST rats. Note the orientation of the maps indicated by the cartoon on the left in C. A. Cortical microstimulation example from rats transected as neonates with weight support, along with sample EMGs from their mapping. Rats with weight-support all showed mid to low trunk motor representations (in blue regions) when mapped using 50 microAmps current pulses in 300ms trains. In intact rats these representations would in general occur caudal to bregma (in the grey shaded regions in A, and see C). The midthoracic ipsilateral and contralateral latissimus dorsi and contralateral suprspinatus were activated at the site circled. B. Muscle diagram. To create microstimulation maps and assess trunk control at different segmental levels the following muscles were recorded: a: semitendinosus, b: iliopsoas, c: multifidus, d: longissimus, e: trapezius, f: supraspinatus, g: biceps femoris, h: external oblique, i: internal oblique, j: rectus abdominis, k: latissimus, l: triceps brachii, m: biceps brachii. Leg muscles (a,g) were never recruited in spinalized rats. Mid to low trunk muscles (c,d and i,j,k and very rarely b) could cause observable pelvic motion either directly or through reflex and mechanical couplings. Trunk or hind-leg segmental level found in ICMS maps was scored from 1 to 7 as shown in (1 upper cervical, 2 upper back, 3 upper shoulder/thorax, 4 mid back, 5 mid to low back, 6 low back / lumbar, 7 legs). The scored values for trunk alone were represented in panels D,E and F in the figure in two ways: they were used as the height parameter for the surface and a false color mesh was applied to the surface with color related to height. The values were interpolated across the ICMS map so as to construct a continuous surface in which height represents the segmental level score and thus the caudal extent of motor recruitment of trunk from each site in the map. In the false color mesh red represents low trunk (color assignments as shown). C. For the normal rat hindlimb recruitment (level 7) is achieved in the caudal region of the map behind bregma (AP coordinate 0 and purple line in each map, grey shaded region in Panel A). D. In WSNST spinalized rats the maximum height was always 6 or less. Weight supporting spinalized rats show peaks at level 5-6 but in TX (spinal transection alone, NST) rats these peaks are rostral to bregma, while in TP (fetal transplant repair NST) and FGR (fibrin glue repair NST) rats these are behind bregma, in the normal intact rats location. (Reproduced from Giszter et al. 2008b). E. Non-weight supported rats are unresponsive to microstimulation in the area behind bregma and the purple line regardless of intervention and show low axial scores of 3-4 (indicated by low hill peaks). Figure redrawn and re-arranged from Figure 6 in Giszter et al. 2008b, J. Neurophysiology, 100(2): 839-51. Epub 2008 May 28.31

