Figure 2.
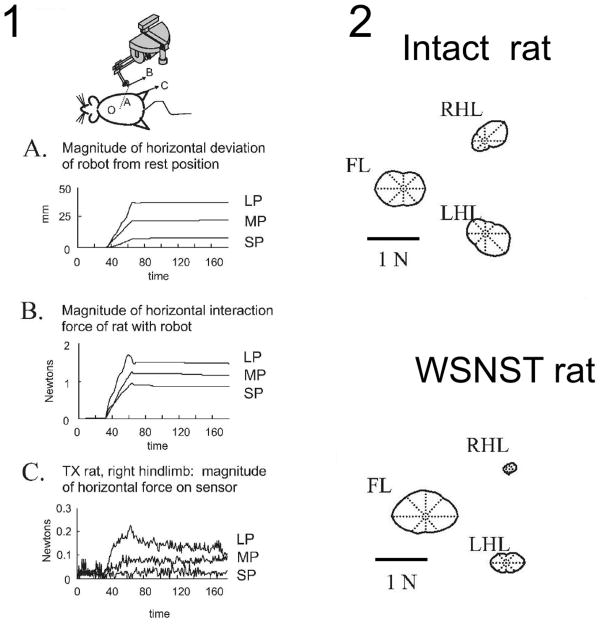
Panel 1. Plots of the responses in perturbation trials for a single direction perturbation applied to an operate rat's stance using the robot and saddle (cartoon above). Shown are :(A) the distance over time of the position of the phantom tip from rest (B), the magnitude of the horizontal plane interaction force between an operate rat and the Phantom, and (C) the magnitude of the horizontal plane ground reaction force at the right hindlimb force-plate sensor. Rats picked a strategy for how to distribute horizontal (‘shear’) forces among the individual leg's ground reaction forces. Data is shown for a WSNST rat (indicated TX in figure). Data are plotted during each size perturbation, all in direction D. Note the small hindlimb force responses in panel C relative to the applied force in panel B in this rat.
Panel 2. Polar plots of tuning curves of the magnitude of the horizontal response forces for different directions of perturbations in the forelimbs and hindlimbs. The polar plots are centered on the compass center. Notice the much reduced hindlimb responses in the WSNST rat. Figure redrawn and rearranged from Figures in Giszter et al. 2007a, J. Neurophysiology. 97(4):2663-75.5

