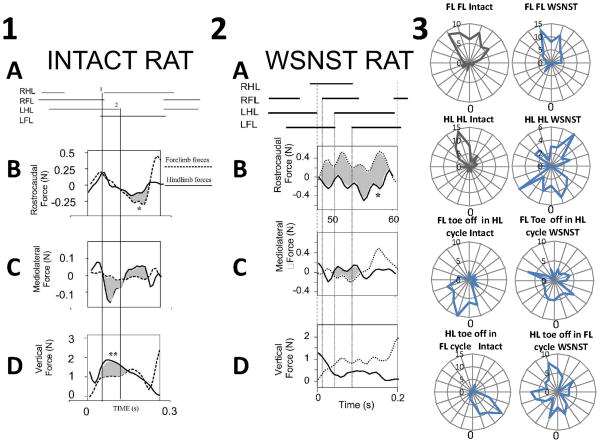
Figure 3.
Forces when a rat spanned two force plates during locomotion, allowing separation of forelimb and hindlimb contributions.
1. Normal rat. Forelimb and hindlimb force contributions to propulsion, stabilization and weight support. Top : stance phase of limbs during transition across plates. A : gait pattern. B: synergistic decelerative and then propulsive actions of forelimbs (dotted line) and hindlimbs (solid line) is shown by overlapping and similarly directed forces. Rostrocaudal forces correlate well. Individual peak contributions (∼0.25N) of forelimbs or hindlimbs are under 10% of body weight (2.7N). In the trial shown forelimbs play a larger part in acceleration (shaded and *). This is within the range of variability from the normal pattern observed in our runway task in which speed was not tightly controlled. C: Lateral forces: most mediolateral force (∼0.15N peak, ∼5% body weight) is exerted in hindlimbs (solid line). Difference of forelimb and hindlimb contributions are shaded. D: Antigravity forces: Hindlimbs (solid line) carry about 60% more body weight than forelimbs (dotted line). The difference is shaded, and indicated by **. Lines 1 and 2 indicate RHL foot strike and LHL lift. Panel redrawn and rearranged from Figure in Giszter et al. 2008a Experimental Brain Research 190(1):53-69.7
2. NWS ST rats. Forelimb and hindlimb propulsive forces are coordinated in opposition in injured rats. Phase II forces are shown and differences shaded. Top : stance phase of limbs during transition across plates. A : gait pattern. B: antagonistic decelerative actions of forelimbs (dotted line) and propulsive forces from the hindlimbs (solid line). Rostrocaudal forces correlate negatively and in a manner significantly different from normal. Individual peak contributions (∼0.5N) of forelimbs or hindlimbs are ∼25% of body weight (<2N). The forces show several peaks per cycle. Not all can be related to stance transitions, e.g. peak at *. C: Lateral forces: mediolateral force (∼0.4N peak) is exerted in both forelimbs (dotted line) and hindlimbs (solid line). D: Antigravity forces: Forelimbs (dotted line) carry about 60% of total body weight here, close to the typical mean of our ST rats, and significantly more than normal rats. Panel redrawn and rearranged from Figure in Giszter et al. 2008a Experimental Brain Research 190(1):53-69.7
3. Phase relations in gait of WSNST rats. Examples of phase distributions of swing onsets calculated for each girdle, and for hindlimb and forelimb on the same side. (FL FL: forelimb swing onset phase in contralateral forelimb cycle. HL HL: hindlimb swing onset phase in contralateral hindlimb cycle. FL in HL: forelimb swing onset phase in ipsilateral hindlimb cycle. HL in FL: hindlimb swing onset phase in ipsilateral forelimb cycle.) Intact rats are in left column of panel 3, WSNST rats are in right column of panel 3. FL FL phase is less variable in WSNST rats, while other phase show more unusual relationships. Note that the phase plotted may be associated with ‘winding numbers’ of one or more for WSNST data, while this was never true in intact rats, i.e. the rat may show multiple steps of one limb, before the measured limb phase is expressed by its toe-off motion. The average gait ratio was around 7:3 forelimb to hindlimb stepping, but there is more phase patterning in the WSNST stepping than this ratio might suggest. New analysis using data from runway experiments shown in panels 1 and 2.

