
Figure 5.
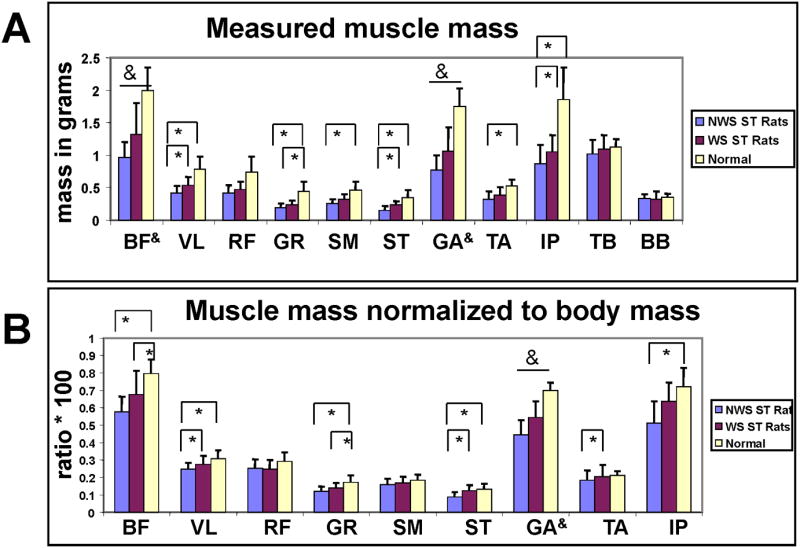
A. Measured muscle masses by weight-support group. NWS ST group (grey) WS ST group (black) N normal group (white). Muscles: 1. BF biceps femoris, 2. VL vastus lateralis, 3. RF rectus femoris, 4. GR gracilis, 5. SM semimembranosus, 6. ST semitendinosus, 7. GA gastrocnemius, 8. TA tibialis anterior, 9. IP iliopsoas, 10. TB forelimb triceps and 11. BB biceps brachii. Vertical bars : standard deviations. Bars and asterisks indicate significant differences in muscle masses (t-tests p<0.05). Ampersands on bars indicate all three comparisons were significant.
B. Muscle Masses of leg normalized to body weight. NWS ST group (grey) WS ST group (black) N normal group (white). Muscles labeled as in A. Vertical bars : standard deviations. Bars and asterisks indicate significant differences in muscle masses (t-tests p<0.05). Ampersands on bars indicate all three comparisons were significant. Data not previously published.